

Gathering accurate data is essential when drawing insights about your client base. To achieve this, researchers must thoughtfully design their surveys and find ways to enhance the likelihood of participants completing them, as higher completion rates enhance the trustworthiness of the data collected.
This article will delve into how survey completion critically influences data reliability. We’ll tackle both how to calculate your survey completion rate relative to the questions posed and how to improve these completion rates.
My objective is to refine the precision and effectiveness of your data-driven decisions. And to keep things engaging, I’ll pepper in examples featuring cats—inspired by my own, who insist on parading over my keyboard as I write.
The Importance of Survey Completion Tracking
Picture this scenario: We enter a lab bustling with feline scientists in tiny lab coats and goggles, all curious about their peers’ opinions on different fish varieties.
They draft a 10-question survey and extend the invite to a diverse group of 100 cats spanning all walks of life—from scrappy alley dwellers to those accustomed to their thrice-daily gourmet meals.
Survey completion metrics include response rate and completion rate, which together reveal what proportion of the 100 cats completed the entire questionnaire. A perfect score of 100% would indicate flawless completion and maximum data accuracy.
However, a full completion rate is a rarity in any scenario.
In this hypothetical study:
- Imagining that 10 cats skip the survey due to nap commitments.
- Out of the 90 who initiate, only 25 answer a few questions before their attention shifts to more pressing matters—like toppling cups.
- Hence, 90 cats contribute some feedback, while 65 finish the entire survey (90 – 25 = 65).
- However, the input of those 25 partial responders is significant—they show a strong preference for salmon.
The cat surveyors net a 72% completion rate (65 out of 90) but this fails to represent the salmon-favoring quarter of responses.
In an alternate narrative, another company, CatCorp, modifies the survey environment by adding a water-filled glass (with a fish, no less!) for each participating cat.
Factoring out the same 10 no-shows and only 10 incomplete survey attempts, the end result is 90 participating cats and 80 completed surveys, amounting to an 88% completion rate. The more robust data enables CatCorp to make informed decisions favoring salmon availability, leading to better profit margins compared to the mildly shortsighted Kitty Committee.
Thus, more comprehensive survey completions translate to more dependable data from which to derive sound business decisions—the ultimate aim.
We quantify completion rates to determine our assurance in the data’s veracity.
In making investment choices, a potential stakeholder, like a savvy Maine Coon entrepreneur, might gravitate towards the company with superior, more reliable decision-making protocols—especially if the offerings align with her preference for salmon.
Defining Survey Completion Rate
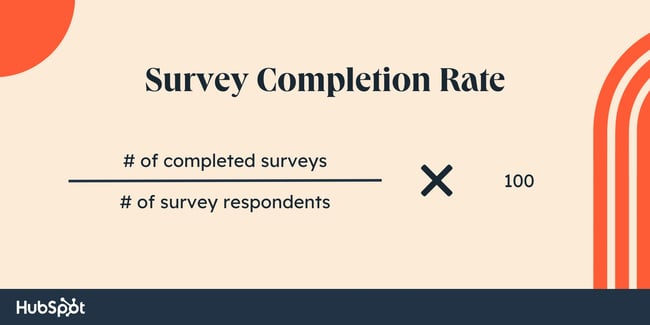
Survey completion rate measures the ratio of fully completed surveys to the total number of respondents. It’s expressed as a percentage by dividing the number of completed surveys by the number of respondents (both complete and partial) and then multiplying by 100.
Let’s get practical with our approach to survey completion rates. Using the straightforward formula:
We identify respondents as those who have engaged with at least one survey question, as opposed to being complete nonresponders.
Take an example: Suppose the Patton Avenue Pet Company sends out a survey to 5,000 email recipients. The analytics report states that 3,000 individuals answered at least one question, with 1,200 completing the survey in its entirety.
The calculation for the Completion rate is straightforward: # of completed surveys divided by the # of survey respondents.
Completion rate = (1,200/3,000) equals 0.40 or 40%, indicating that 40% of the respondents answered the survey fully.
Distinguishing Response Rate from Completion Rate
We understand the significance and method to evaluate the completion rate, but we shouldn’t overlook the distinct concept of the response rate, calculated differently.
- Completion Rate = Total # of Completed Surveys ÷ # of Respondents
- Response Rate = Total # of Respondents ÷ Total # of Surveys Sent Out
Application to the above example:
Completion Rate = (1200 out of 3000) = 40%
Response Rate = (3000 out of 5000) = 60%
In summary:
- Completion rate: Indicates the percentage of respondents that see your survey through to the end, crucial for data accuracy.
- Response rate: Represents the share of people engaged to any extent with the survey.
The pressing question becomes: How can we elevate this metric to ensure a broader, truer dataset from our surveyed subjects?
We’ll continue to unpack strategies to elevate response and subsequently completion rates.
What Equates to a Solid Survey Completion Rate?
This isn’t a one-size-fits-all question; various factors complicate the determinant factors, such as survey nature, industry-specific contexts, target populations, desired confidence levels, and acceptable margins of error.
Before we contemplate ideal completion rates, it’s pivotal to nurture robust response rates first.
Delving into the Qualtrics community, I encountered discussions concerning the norms for online B2B response rates:
“Is there an industry standard for online B2B CX survey response rates? […]
With current rates at 6%–8%, there’s a drive to enhance this but grasping a benchmark standard is needed first.”
A respondent from a government service provider mentioned achieving a 30–40% response rate for transactional surveys, given their free-to-use service which vastly influences the rate.
That said, recent information from Qualtrics suggests that response rates can be variable, depending on your outreach methods. It mentioned an 85% response rate for certain employee-centric surveys and up to 33% for customer-centric ones via email.
A good response rate typically ranges from 5% to 30%, with an exceptional rate being over 50%, as echoed by reports from both Customer Thermometer and SurveyMonkey. These peak rates are often attributed to a compelling incentive to complete the survey or a personal connection between the customer and the brand.
Businesses with minimal direct customer interactions can expect a lower response rate, as anonymity typically correlates with diminished engagement levels.
With whatever response rate you achieve, continually strive to amplify it, thus bolstering your completion rate chances. How? Let’s explore some tips.
Guidelines for Elevating Survey Completion
For those looking to augment survey completions, consider the following guidelines:
1. Aim for Conciseness with Your Surveys.
Avoid the temptation to overload your survey with multiple inquiries. Rather, strive for brevity wherever possible.
Completion rates tend to inversely correlate with question count—brevity is beneficial unless you incentivize lengthier sessions.
As advised by Pamela Bump, HubSpot’s Head of Content Growth, aiming for enriching experiences over exhaustive lists is key. “If you reward respondents proportionately, you’re more likely to receive thoughtful, comprehensive replies. But avoid extensive surveys that might overwhelm or disengage participants,” she notes.
2. Entice Participants with Incentives.
Gauge your audience’s motivations and reward their commitment accordingly. Incentives can be as imaginative as you wish, providing a ‘thank you’ for their time and potentially nudging them toward future engagements with your brand.
3. Prioritize Clarity and Simplicity.
Maintain a straightforward survey flow. Clear, concise questions not only increase the likelihood of accurate responses but also keep participants from disengaging due to confusion or frustration.
4. Tailor Your Approach to Your Audience.
Understanding your customer demographics helps to pinpoint the optimal means of interaction. As an anecdote, Pamela Bump shares a learning experience where a pruned, more focused survey outperformed its initial bloated iteration due to audience preference for succinct content.
5. Introduce a Fun Element to the Survey Experience.
Gamification can transform mundane questionnaires into enjoyable interactive segments. Crafting surveys with engaging visuals or interspersed rewards can significantly boost interaction—and completion rates.
It’s Your Turn to Amp Up Survey Completions
Armed with these insights, you’re prepared to delve into the world of survey administration. Keep in mind that honoring the participants’ time is key to eliciting valuable input. Short, enjoyable surveys are likely to yield better completion stats.
Editor’s note: This post was originally published in December 2010 and has been updated for comprehensiveness.


